Reports and analytics
Turn volunteer data into clear reports for staff, boards, and funders.
Extensive preloaded reports and statistical reporting paired with unmached custom reporting options means your team has the tools it needs for daily operations, grant writing, board meetings and future planning.
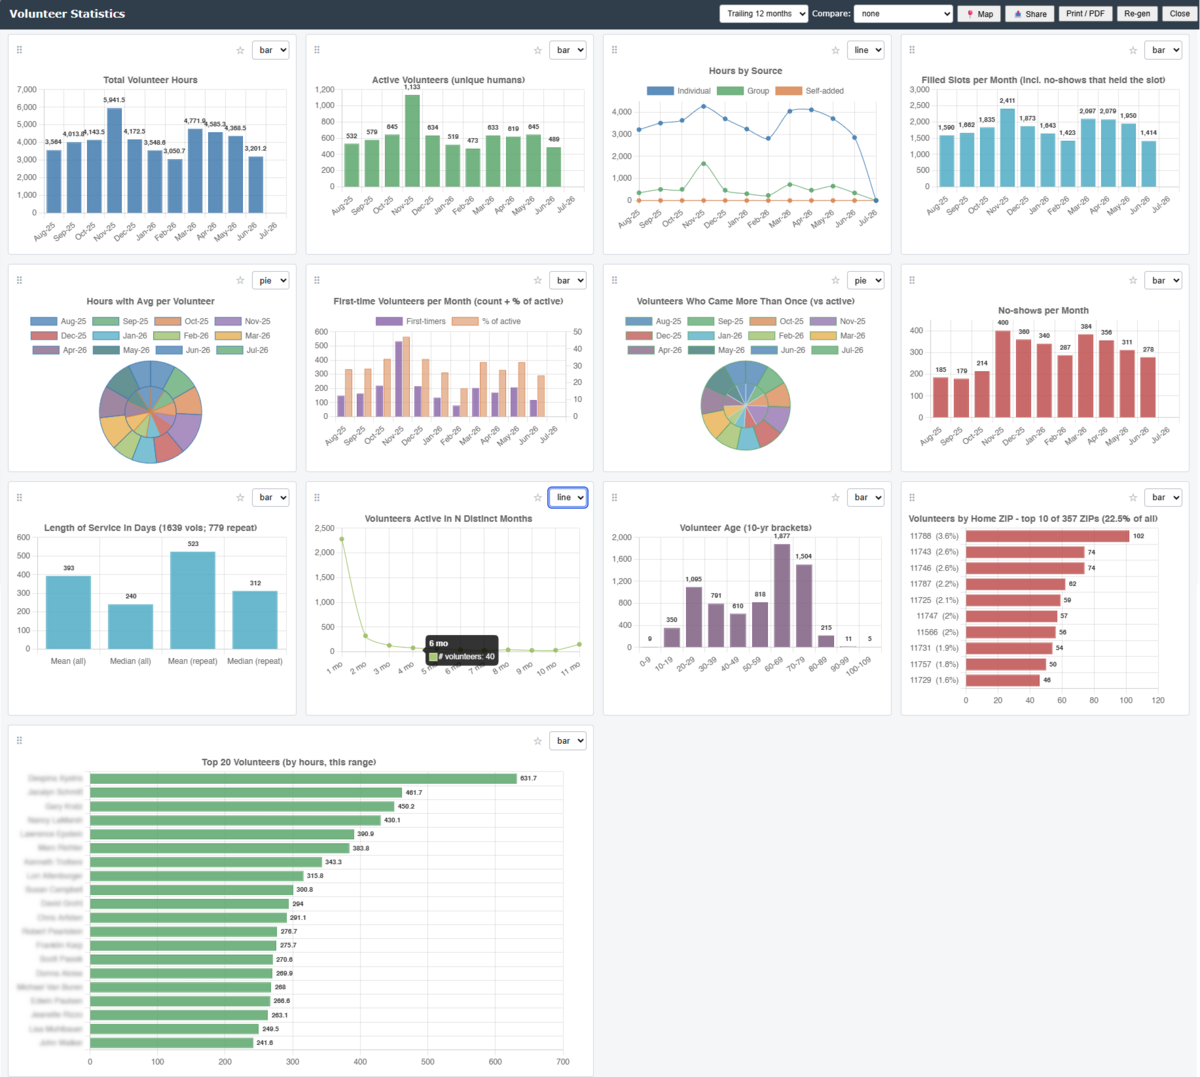
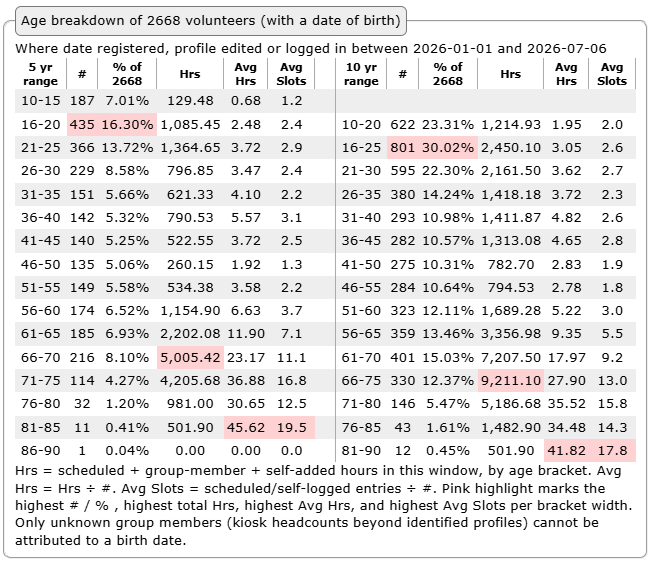
You haven't seen volunteer program statistics until you have see what Volunteer matrix offers. Most other software systems don't even attempt any analytics at all, providing you with raw csv data to try to find another system to analyze that data. This means allot of the possible granularity is lost since you aren't able to manipulate the data sets to really tease out the information you want and need.
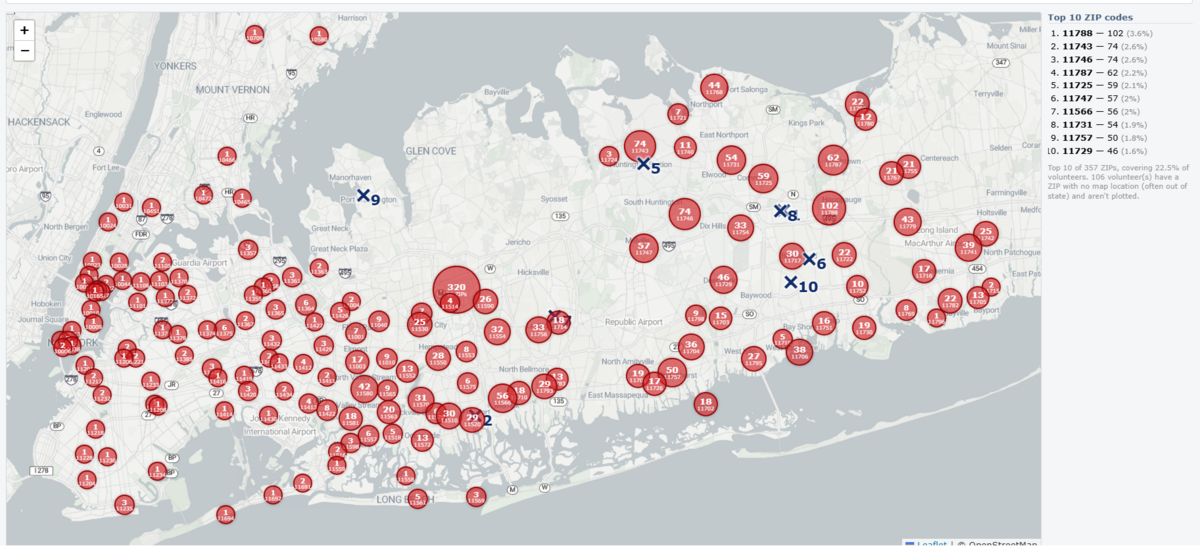
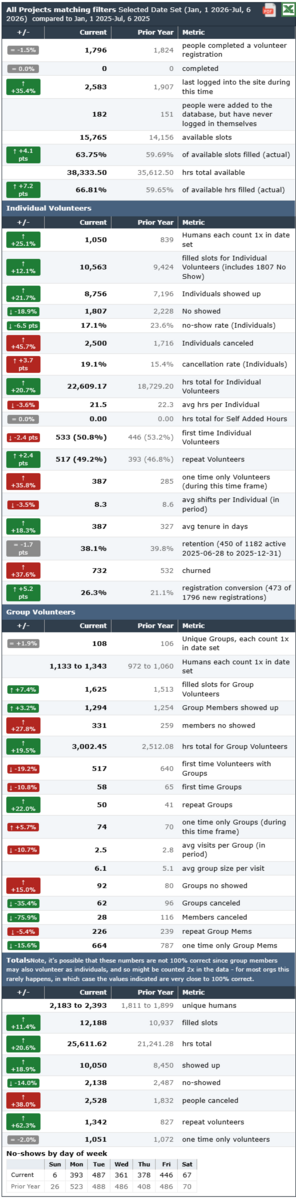
Here's just a few examples of what you can expect from Volunteer Matrix - and note, that you will be able to run all these reports, statistics, etc. on all of your imported past data as well.
What teams use this for
Volunteer Matrix is built to handle real program complexity: multiple locations, multiple roles, and different eligibility rules without spreadsheet sprawl.
- Hours, attendance, and coverage metrics.
- Retention and repeat-volunteer trends.
- Program breakdowns by location and role.
- Export-friendly outputs for stakeholders.
- Emailed daily automated reports
- Executive overview stats & reporting emailed weekly/monthly